The PERT Chart Template Excel is a tool used by the project manager for evaluation of the project schedule in terms of project completion time, activities, and project cost.
Thank you for reading this post, don't forget to subscribe!PERT charts, originating from the 1950s for navy project management, now stand as pivotal tools in modern project management. These charts enable project managers to visualize task sequences and durations, providing a clear roadmap for complex projects.
It’s a formulated tool developed in MS Excel to enhance the compatibility, editing, and customization features of the template.
PERT Chart
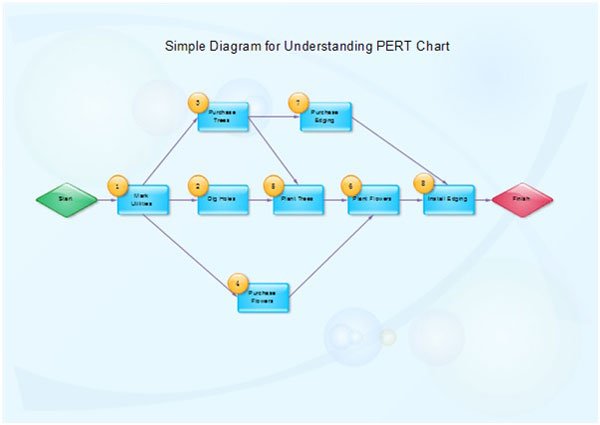
PERT stands for Project Evaluation and Review Technique. The PERT chart is a final visual representation of the PERT network diagram after the application of calculations.
However, the PERT method is pretty similar to CPM. Although it has the advantage over the CPM in terms of better estimation of the project activities completion time.
The CPM and PERT tools are a very important part of the project planning phase. The successful scheduling of project is the result of these techniques.
PERT Chart looks similar to the precedence network diagram. The same diagram is used in the critical path method for analysis.

The outcome of the PERT chart is the elimination of all the redundant activities from the work breakdown structure of a project.
Project management requires a number of activities as well as proper project tracking down so that no one can leave behind. It is not that one person is left at stage A while others are proceeded to stage C as they are interlinked with one another when they are working as a team and secondly activities are interlinked with one another too.
Even the easiest and most complicated projects, both require pert chart excel to prevent any wrong assumptions about objectives and the time limit available to complete them.
Once a table is available that outlines different factors, not only management is improved in fact, but as a manager you are able to increase the efficiency of your project increasing the chances of your promotion and taking along your team members as well. During creating a project portfolio dashboard these stats need you.
Complex situations and difficult time targets in a specific project can be easily managed by perfect and highly collaborative teams; therefore project managers keep on adding strategies, which can link the team members with one another and complete the project in a given timeline.
Integration with Project Management Practices
Integrating a PERT chart into project management begins with a clear understanding of the project’s scope. Each task or activity in the project plan finds a place in the PERT chart as a distinct node. The crucial aspect lies in detailing the sequential relationship between these tasks. By displaying dependencies, it becomes clear which tasks must precede others and which can occur concurrently. This organization is vital for planning resources and timelines.
A PERT chart’s value emerges in its ability to offer a holistic view of the project timeline. Time estimates for each task – optimistic, pessimistic, and most likely – are incorporated, offering a comprehensive view of project duration. These estimates allow project managers to identify critical paths – sequences of tasks that directly affect the project’s end date. Understanding these paths is fundamental to prioritizing tasks and allocating resources.
Case Studies of Successful Implementation
Applications of PERT charts in project management emphasize their utility. For instance, construction projects benefit significantly from PERT chart implementation. By visualizing the entire project timeline, managers can predict bottlenecks and plan accordingly, ensuring that delays in one task don’t cascade through the entire project.
In software development projects, where tasks are often complex and interrelated, PERT charts help in visualizing dependencies. This visibility is crucial for agile project management, where flexibility and adaptability are key. PERT charts assist in adjusting schedules and resources dynamically as project requirements evolve.
Maximizing Efficiency and Accuracy
To maximize the efficiency and accuracy of a PERT chart in project management, regular updates are essential. As projects progress, the chart should evolve to reflect the current status of tasks, revised time estimates, and changes in task dependencies. This dynamic approach ensures that the PERT chart remains a reliable tool throughout the project lifecycle.
In conclusion, implementing a PERT chart in project management is a strategic approach that enhances clarity, efficiency, and accuracy in handling complex projects. Its ability to detail task sequences, estimate time frames, and identify critical paths makes it an indispensable tool in modern project management techniques.
What is the difference between PERT Chart Template Excel and CPM Template?
It is important to understand the difference between the two famous project scheduling and evaluation techniques. Both techniques follow almost exactly the same steps for calculation.
However, the only difference in both techniques is in the estimation of project activity completion times. The CPM technique uses a unique deterministic estimate of time for the whole calculation of critical path, critical and non-critical activities, and slacks.
However, the PERT chart is developed based on special time estimations generated from three different completion estimates of the project tasks.
Benefits of Using Excel PERT Chart Template
The fundamental use of PERT chart analysis is in the project scheduling process of the project management domain. However, this technique is used in many other domains due to its potential benefits.
The outcomes of the PERT chart analysis are the following:
- PERT network diagram to support visualization of project task dependencies.
- The critical path of the project.
- Project completion time
- Critical tasks and Non-Critical tasks of the project.
- Slack or Float of the project’s non-critical activities.
The above benefits of the PERT chart analysis can only be achieved on a complete understanding of the following terms of PERT Chart analysis:
- WBS
- List of Tasks
- Mean Time
- PERT Tasks
- PERT Event
- PERT Predecessor Event
- PERT Successor Event
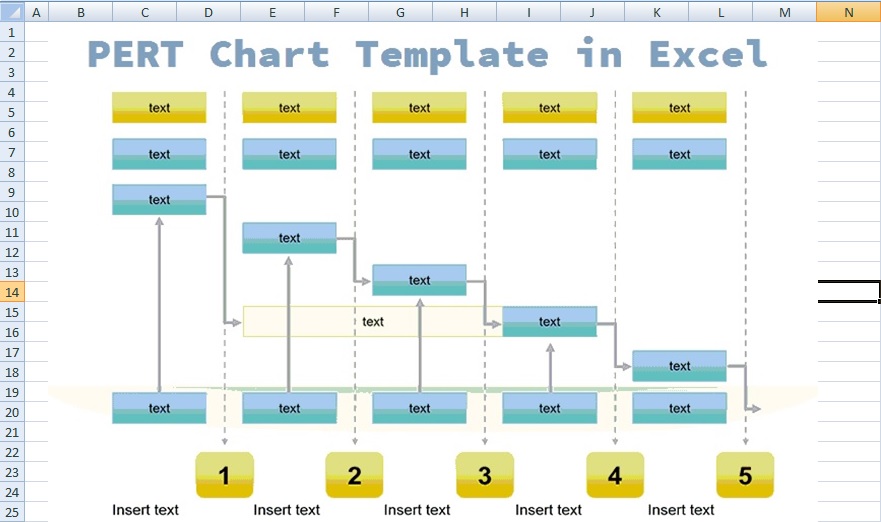
Pert Chart Template In Excel Format
Advanced Features in Excel for PERT Charts
Excel offers customization through formats, styles, and conditional formatting. Automation through macros can further streamline the process, making the management of complex projects more efficient.
Common Challenges and Solutions
Complex projects can make PERT chart creation challenging. However, breaking down projects into smaller, manageable components can enhance accuracy and efficiency.
Comparative Analysis with Other Project Management Tools
While PERT charts are useful, it’s important to compare them with tools like Gantt charts. Each has unique advantages and can be more suitable depending on the project’s nature.
Best Practices for PERT Chart Management
Regular updates to your PERT chart ensure it remains relevant and useful. Collaboration features in Excel allow team members to contribute and stay updated.
Analyzing Project Progress with PERT Charts
PERT charts are excellent for monitoring project milestones and conducting predictive analysis. They help project managers stay on track and foresee potential delays.
PERT Charts for Risk Management
Identifying and mitigating risks is a crucial part of project management. PERT charts aid in recognizing potential risks and developing strategies to address them.
Role of PERT Charts in Resource Allocation
Effective resource allocation is crucial for project success. PERT charts can help project managers plan and allocate resources efficiently, as demonstrated in various case examples.
Impact of PERT Charts on Project Success
Using real-world success stories, we can see how PERT charts contribute to project success. Key metrics for measuring success include timely completion and staying within budget.
Training and Skill Development for PERT Charting
Effective use of PERT charts in Excel requires specific skills. Resources for training and skill development are readily available for project managers.
Steps to Make PERT Chart Template in Excel
The PERT chart template excel creation is similar to critical path analysis. It involves the creation of a table the information about WBS, all the tasks, dependencies, and meantime estimates.
Using the activities meantime, sequence, and list of tasks a PERT network chart is developed. Moreover, the forward and backward pass techniques are used for finding all the potential outputs of the PERT chart method.
It is recommended to write the task WBS number and mean duration on the arrows of the PERT diagram.
- Critical tasks, which are not otherwise managed or result in loss of resources can be avoided by pert charts.
- Use the same prepared chart for different projects, especially if they are linked or have any similarities.
5 Common FAQs
Here are some most common FAQs related to this project management template that are following;
How does a PERT chart differ from a Gantt chart?
A PERT chart focuses on task sequences and time estimates, whereas a Gantt chart emphasizes task duration and overlaps on a timeline.
Can PERT charts handle very complex projects?
Yes, PERT charts are suitable for very complex projects due to their ability to detail task dependencies and time estimates.
Are there any specific industries where PERT charts are most effective?
PERT charts are most effective in industries like construction, software development, and event planning, where project complexity and task dependencies are high.
How often should a PERT chart be updated?
A PERT chart should be updated regularly, ideally whenever there are significant changes in project scope, tasks, or timelines.
Can PERT charts help in risk management?
Yes, PERT charts aid in risk management by identifying critical paths and potential bottlenecks, allowing for proactive planning and mitigation strategies.Yes, PERT charts aid in risk management by identifying critical paths and potential bottlenecks, allowing for proactive planning and mitigation strategies.

Please could i be supplied with a PERT chart template please 🙂
Sure Anthony, but this tool is in our bundle pack.